Mastering the Basics of Data Analytics
This article provides a comprehensive overview of data analytics, including its fundamentals, different types, and applications. If you are new to Data Analytics start here!
TLDR
Embarking on the journey to attain the AWS Certified Data Analytics – Specialty certification requires a solid grasp of the fundamentals. This article is a comprehensive guide covering essential information to kickstart your preparation.
I wanted to prepare the AWS Certified Data Analytics – Specialty certification, but I had to start with the basics. I wrote this article to try to cover all the important information you should know before start to study.
Let’s cover the fundamentals of data analytics.
1. Understanding Data Analytics
Data analytics is the practice of examining and interpreting raw data to discover meaningful patterns, extract valuable insights, and make informed business decisions. It involves the use of statistical analysis, data mining techniques, and visualization tools to gain a deeper understanding of data and its significance.
- For children: Data analytics means looking at lots of information very carefully to find important clues and answers to questions. It’s like being a detective who uses special tools to solve mysteries by studying all the evidence and putting the pieces together.
2. Decoding Big Data
Big Data refers to extremely large and complex datasets (generated from various sources) that are challenging to process and analyze using traditional methods.
- For children: Big Data means having so much information from lots of places that it’s hard to handle and understand without special tools. It’s like having a giant puzzle with many pieces that we need to put together to learn new things.
3. AWS Certification Evolution: From “Big Data” to “Data Analytics”
Wondering why the AWS certification transitioned from AWS Certified Big Data - Specialty to AWS Certified Data Analytics - Specialty? This change mirrors the evolving landscape of data analytics, expanding beyond big data processing to encompass a broader range of analytics techniques and services offered by AWS.
4. Knowing When to Use Data Analytics
When to use analytics depends on the three Vs: volume, velocity, and variety of data.
Volume: Analytics is useful when dealing with a large amount of data that is too vast to process manually. By using analytics tools, you can efficiently analyze and gain insights from massive data sets that would be otherwise overwhelming.Velocity: Analytics is beneficial when dealing with data that is generated at high speeds and requires real-time or near-real-time analysis. For example, in industries like finance or e-commerce, where transactions occur rapidly, analytics helps monitor and analyze data in real-time to detect anomalies, make quick decisions, or respond to changing conditions promptly.Variety: Analytics is valuable when dealing with diverse data types and formats. It involves processing and analyzing structured data (e.g., spreadsheets), semi-structured data (e.g., XML files), and unstructured data (e.g., social media posts, emails). Analytics tools can handle this variety of data, allowing you to extract insights from different sources and formats.
Analytics is then used when there is a large volume of data, data is generated at high speeds, and data comes in various types and formats.
Here are some examples:
- Understanding customer behavior: Businesses can use data analytics to analyze customer preferences, purchasing patterns, and behavior to better understand their needs and provide personalized experiences.
- Improving operational efficiency: Data analytics can be applied to optimize processes, identify bottlenecks, and streamline operations, leading to cost savings and increased productivity.
- Enhancing marketing strategies: By analyzing data on customer demographics, interests, and online behavior, companies can create targeted marketing campaigns, tailor advertisements, and improve customer engagement.
- Predicting trends and forecasting: Data analytics can help forecast market trends, demand for products or services, and emerging opportunities, enabling organizations to make proactive decisions and stay ahead of the competition.
- Fraud detection and risk assessment: Data analytics plays a crucial role in detecting fraudulent activities, identifying anomalies, and assessing risks across various industries, such as finance, insurance, and cybersecurity.
- Healthcare and medical research: Data analytics is used to analyze large volumes of medical data, patient records, and genetic information to improve diagnoses, develop new treatments, and advance medical research.
5. Classifying Data
Understanding the type of data is essential for determining the appropriate storage, analysis, and processing methods. Each data type requires different tools and techniques to make sense of the information it contains.
Data can be classified into different types based on its structure and organization. Here are three main data types:
Structured Data: Structured data refers to well-organized and formatted data that fits into predefined schemas or tables. It has a fixed format with clearly defined fields and relationships.- Examples of structured data include data stored in relational databases like Amazon RDS (Relational Database Service). Structured data is easily searchable and can be queried using specific languages like SQL.
Semi-structured Data: Semi-structured data does not conform to a rigid schema but has some organizational elements. It contains both structured and unstructured elements, allowing flexibility in data representation.- Examples of semi-structured data formats include non-SQL databases, XML (eXtensible Markup Language), JSON (JavaScript Object Notation), and CSV (Comma-Separated Values) files.
- Semi-structured data can be queried using specialized query languages or transformed into structured formats for analysis.
Unstructured Data: Unstructured data refers to data that does not have a predefined structure or organization. It does not fit into traditional rows and columns like structured data.- Unstructured data includes text documents, images, videos, social media posts, emails, and sensor data.
- Analyzing unstructured data requires advanced techniques like natural language processing (NLP), computer vision, and machine learning algorithms to extract valuable insights.
6. Types of Analytics
There are three main types of analytics:
DescriptiveAnalytics: focuses on summarizing historical data to understand what has happened in the past. It involves aggregating and analyzing data to uncover patterns, trends, and key performance indicators (KPIs). Descriptive analytics helps in gaining insights into past events and provides a foundation for further analysis.PredictiveAnalytics: involves using historical and current data to make predictions or forecasts about future events or outcomes. It leverages statistical models, machine learning algorithms, and data mining techniques to identify patterns and trends and make data-driven predictions. Predictive analytics helps organizations anticipate customer behavior, optimize operations, mitigate risks, and improve decision-making processes.PrescriptiveAnalytics: goes beyond predicting future outcomes and recommends actions to optimize decision-making. It utilizes advanced analytics techniques, optimization algorithms, and simulation models to provide insights on what actions should be taken to achieve desired outcomes. Prescriptive analytics helps in making informed decisions and taking proactive measures to drive desired results.
7. Two Approaches to Data Processing
Batch Analytics: Batch analytics involves processing large volumes of historical data in batches or groups. It focuses on analyzing data accumulated over a specific period, such as hours, days, or weeks. Batch analytics allows organizations to gain insights from past data trends and patterns. It is commonly used for tasks like generating reports, identifying long-term trends, and performing retrospective analysis.Real-time Analytics: Real-time analytics refers to the analysis of data as it is generated or received, providing immediate insights and responses. It enables businesses to make instant decisions and take immediate actions based on incoming data. Real-time analytics is valuable for scenarios that require timely information and quick responses.
8. The Data Analytics Process
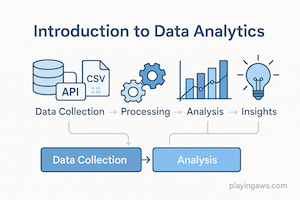
The data analytics process involves four steps:
- Collect/Ingest: In this step, data is gathered from various sources and ingested into a storage system, such as Amazon S3 or Amazon Redshift.
- Store: The collected data needs to be stored in a scalable and secure manner. AWS provides several services for data storage, including Amazon S3, Amazon Redshift, and Amazon DynamoDB.
- Analyze/Process: Once the data is stored, it can be processed and analyzed using various AWS services like Amazon EMR, AWS Glue, or Amazon Athena. These services offer tools and frameworks for data transformation, exploration, and running advanced analytics algorithms.
- Visualize: The final step involves visualizing the analyzed data to derive meaningful insights. AWS services like Amazon QuickSight and Amazon Kinesis Data Analytics provide visualization capabilities to create interactive dashboards, reports, and real-time data visualizations.
If you want to know more you can review this official link about What Is Data Analytics?