Adding Real User Monitoring to my blog with CloudWatch RUM
1. Introduction
I’ve been wanting to check out this service for a while, and now I have the perfect excuse: to integrate it into my blog (a static website built with Jekyll and deployed on Amazon S3 and CloudFront -> More information here).
In this article, we’ll explore Amazon CloudWatch RUM (Real User Monitoring): what is it, how it works, and how you can set it up to improve the performance of your web applications.
2. Amazon CloudWatch RUM (Real User Monitoring)
2.1. What is it?
Amazon CloudWatch RUM (Real User Monitoring) is designed to help track and optimize your web applications by providing real-time insights into user interactions, performance issues, and errors, which you can use to quickly identify and debug client-side performance issues.
2.2. What to do?
CloudWatch RUM provides a range of metrics and insights, including the following:
- Performance Monitoring: Measures page load times, render times, and other key performance indicators.
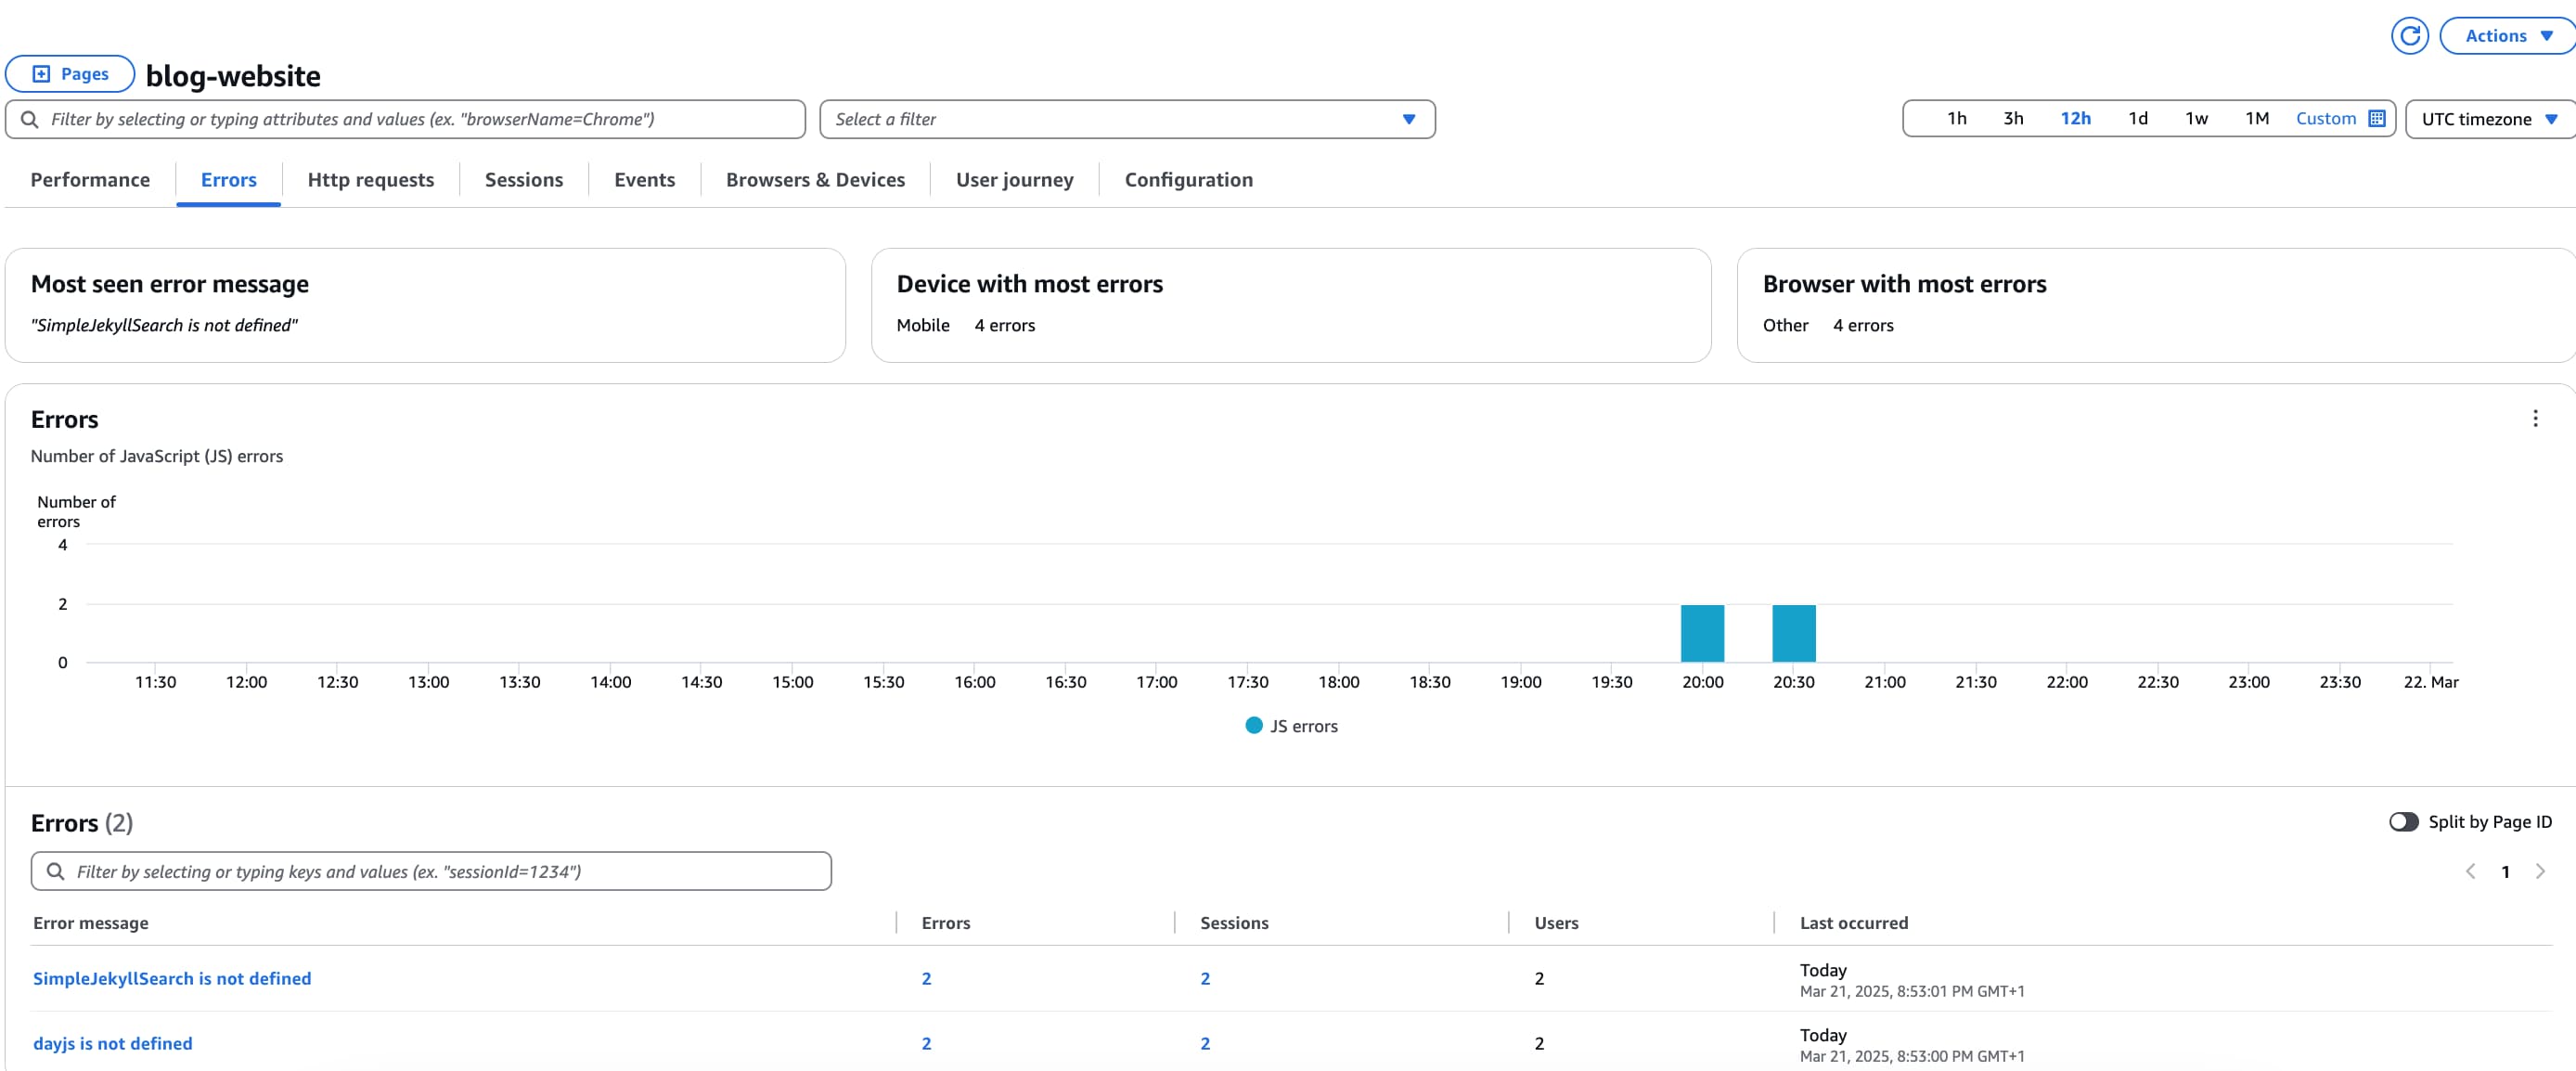
- Error Tracking: Captures JavaScript errors, HTTP errors, and browser compatibility issues.
- User Behavior Analysis: Analyzes how users navigate your site and identifies bottlenecks.
- Session Analytics: Tracks user behavior across sessions to provide deeper insights into the overall experience.
- Geographic insights: Monitor performance across different regions.
- Browser & Device Analytics: Track performance across various browsers and devices.
2.3. How it works?
CloudWatch RUM collects data from actual user interactions in near real time. When a user visits your website, a lightweight JavaScript agent sends telemetry data to Amazon CloudWatch, which is then processed and visualized in dashboards, allowing you to monitor performance, detect anomalies, and troubleshoot issues efficiently.
Remember that CloudWatch RUM will add a small JavaScript agent to your pages, which may
introduce a minimal performance impact. While the script is lightweight, it still contributes to page load time, so be mindful of this, especially on performance-sensitive websites.
3. Setting Up CloudWatch RUM
To start using CloudWatch RUM, follow these steps:

- Step 1: Create a CloudWatch RUM Application
- Add your application and get a JavaScript snippet to paste into the header of your application: link with more information.
- Step 2: Add the CloudWatch RUM JavaScript Snippet
- Paste the JavaScript code snippet into the
headersection of your application.
- Paste the JavaScript code snippet into the
- Step 3: View and Analyze Data
- Monitor for performance, page load speeds and errors across user sessions.
3.1. Step 1: Create a CloudWatch RUM Application
To configure your CloudWatch RUM Application effectively, you’ll go through the following important settings:
- Define Application Domain(s): Specify 1-5 domains where RUM will collect data.
- Configure RUM Data Collection: Decide what type of telemetry you want to capture. You can enable:
Performance telemetry: Captures page load times, render times, and Core Web Vitals.JavaScript errors: Logs unhandled exceptions that occur in your web app.HTTP errors: Monitors failed API calls or HTTP request issues.
- Set Up Data Recording Preferences:
- If your application is public, enable a public resource-based policy to accept unauthenticated RUM events.
- If you need stricter security, configure authorization using Amazon Cognito Identity Pools or private authentication.
- Customize Recording Scope: You can include or exclude specific pages from RUM tracking.
- Generate the Code Snippet: This is the key part. CloudWatch provides different ways to integrate the RUM agent into your website:
TypeScriptintegration for advanced use cases.JavaScriptintegration for dynamic applications.HTMLsnippet for simple static sites (ideal for my Jekyll blog).
3.2. Step 2: Add the CloudWatch RUM JavaScript Snippet
After selecting your configuration, CloudWatch generates a JavaScript snippet. This must be added to your website’s <head></head> section to start tracking real user interactions.
Once you have your code and have selected the integration option, you will need to update your website to include it.
In my case, for my blog, I had to include the following code:
1
2
3
4
5
6
7
8
9
10
11
12
13
14
15
16
17
18
    <!-- Real User Monitoring with CloudWatch RUM -->
    <script>
        (function(n,i,v,r,s,c,x,z){x=window.AwsRumClient={q:[],n:n,i:i,v:v,r:r,c:c};window[n]=function(c,p){x.q.push({c:c,p:p});};z=document.createElement('script');z.async=true;z.src=s;document.head.insertBefore(z,document.head.getElementsByTagName('script')[0]);})(
        'cwr',
        '98537d86-ca5e-4a41-a8f8-a11631692ef5',
        '1.0.0',
        'eu-west-1',
        "/assets/js/cwr.min.js",
        {
            identityPoolId: "eu-west-1:e24933c6-470e-45cf-892d-b1d88cb8e9de",
            sessionSampleRate: 1,
            endpoint: "https://dataplane.rum.eu-west-1.amazonaws.com",
            telemetries: ["performance","errors","http"],
            allowCookies: true,
            enableXRay: false
        }
        );
    </script>
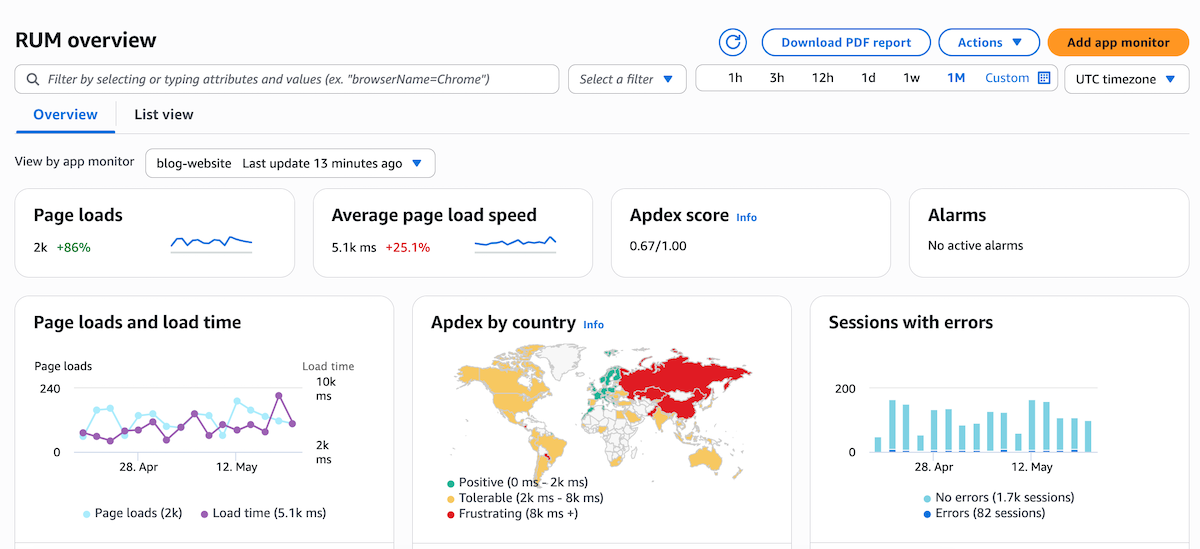
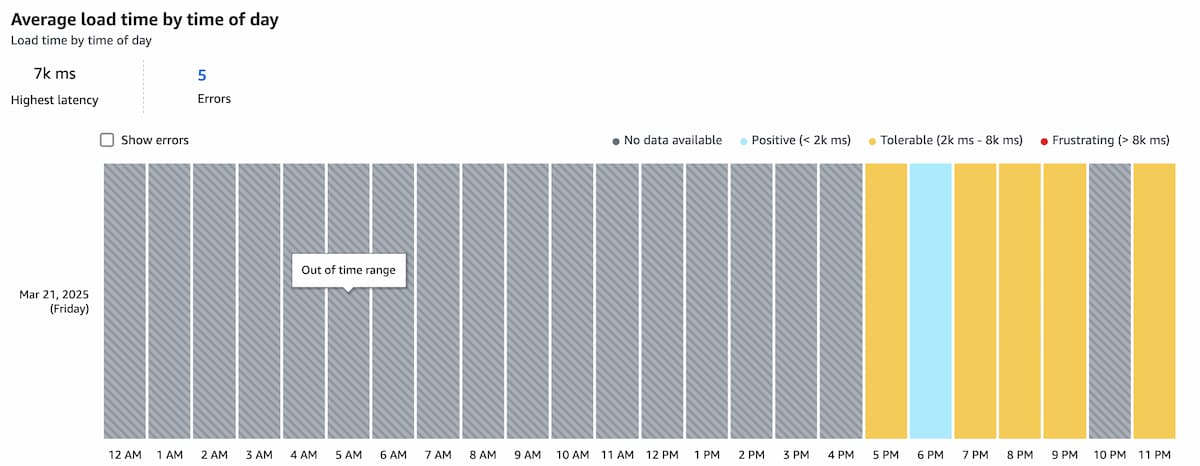
3.3. Step 3: View and Analyze Data
Once data is collected, you can analyze it to gain insights into application performance.
CloudWatch RUM provides two views in the home page:
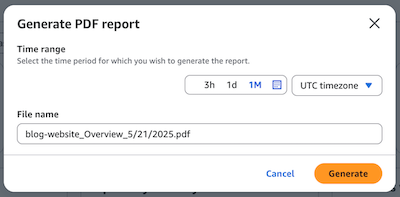
- Overview: view of all your app monitors together. You can also download the report in pdf.
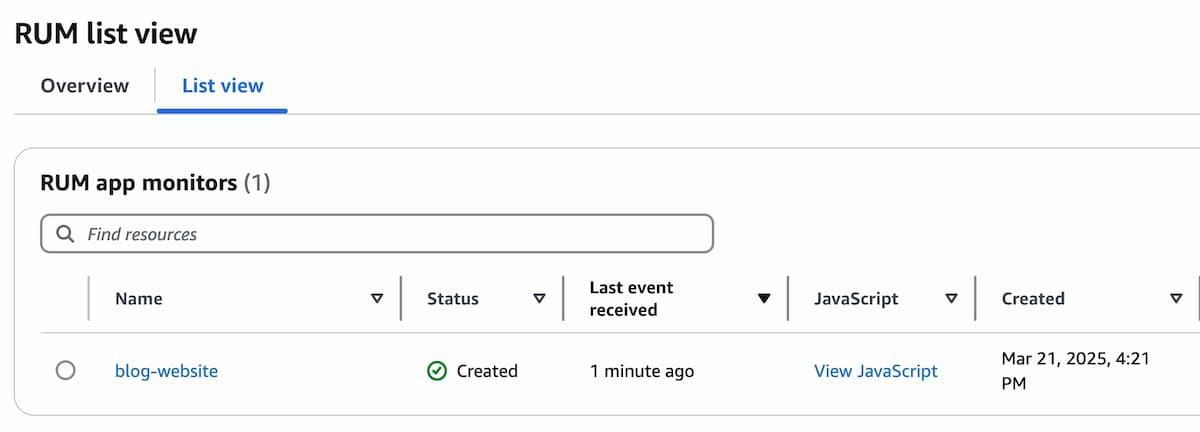
- List view: list with your specific app monitors
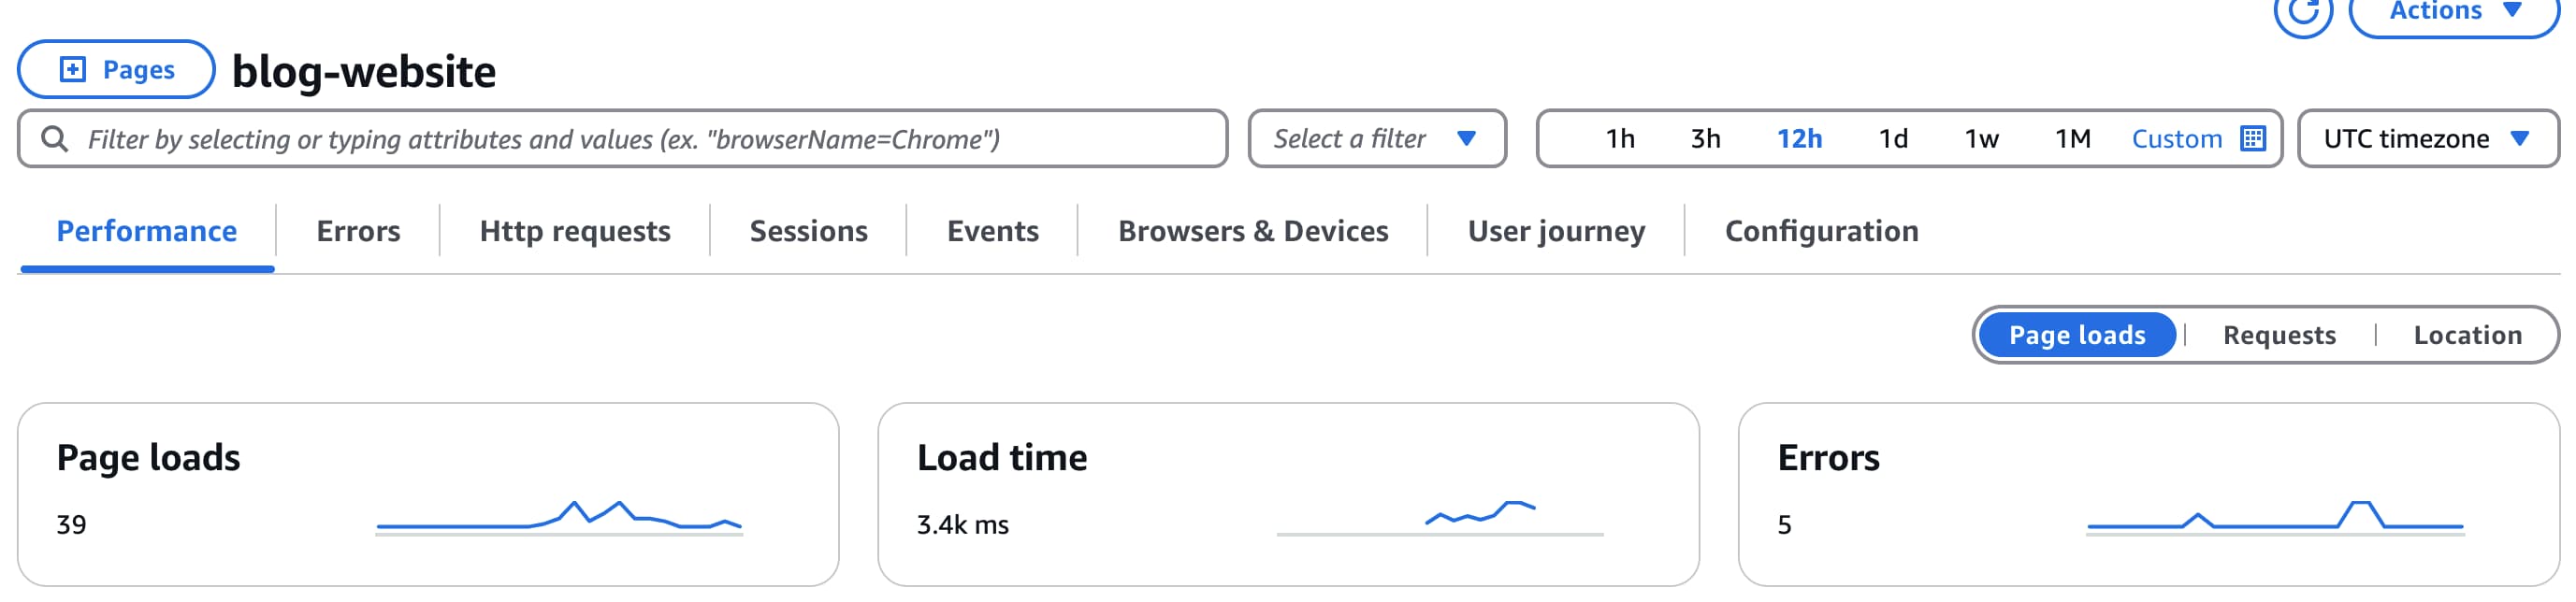
And then, inside each app monitor, you can access information about:
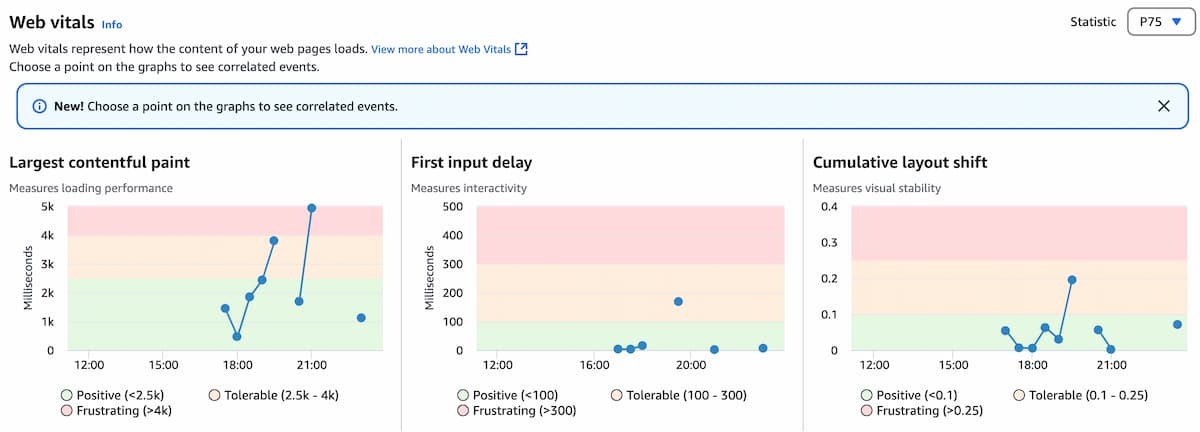
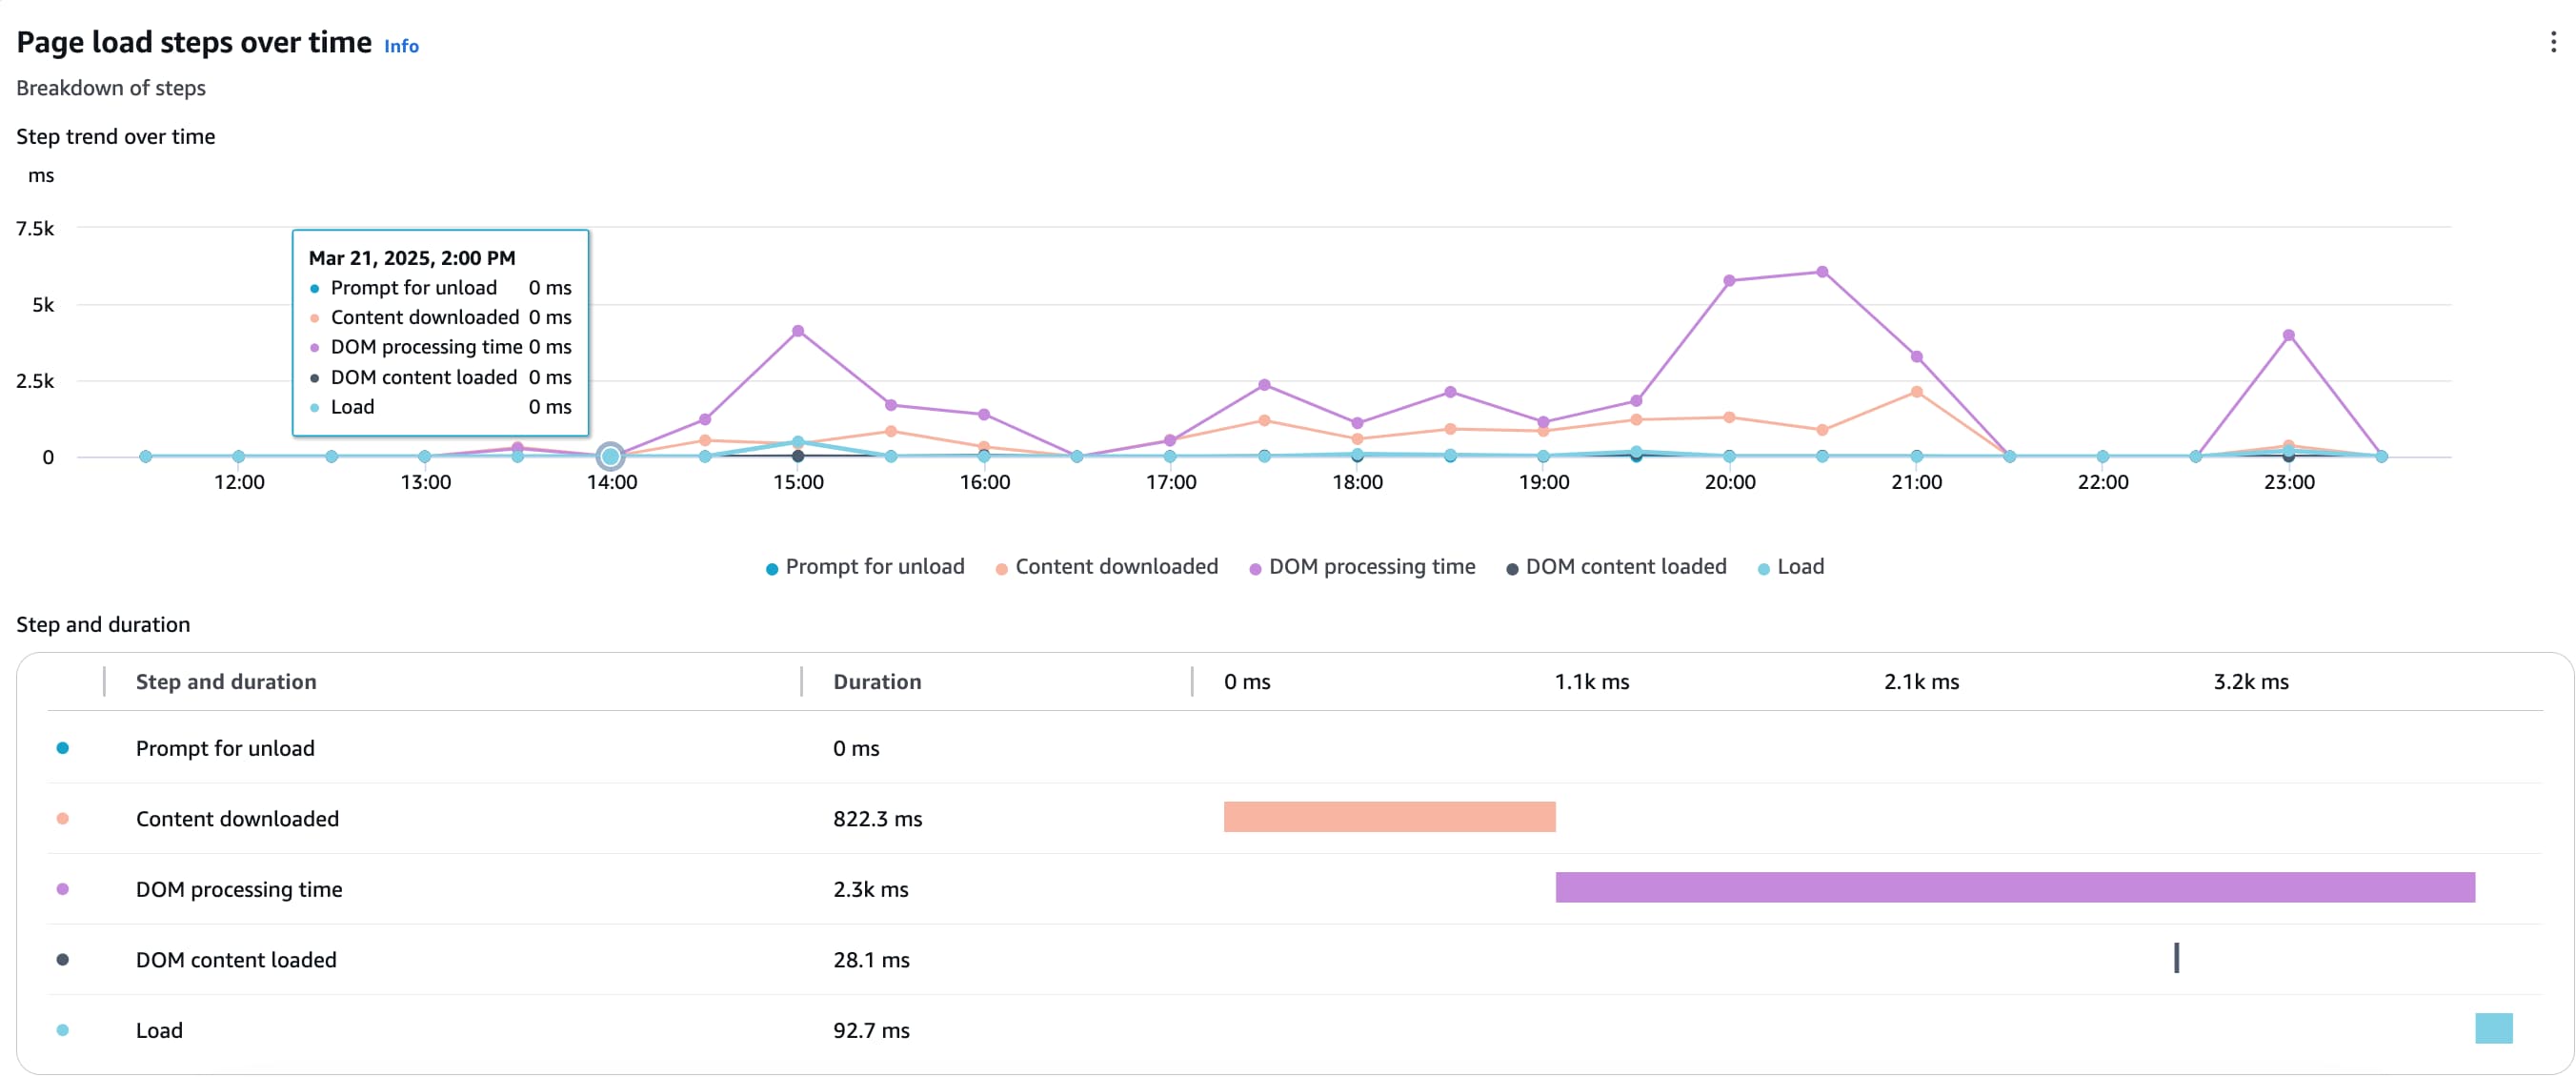
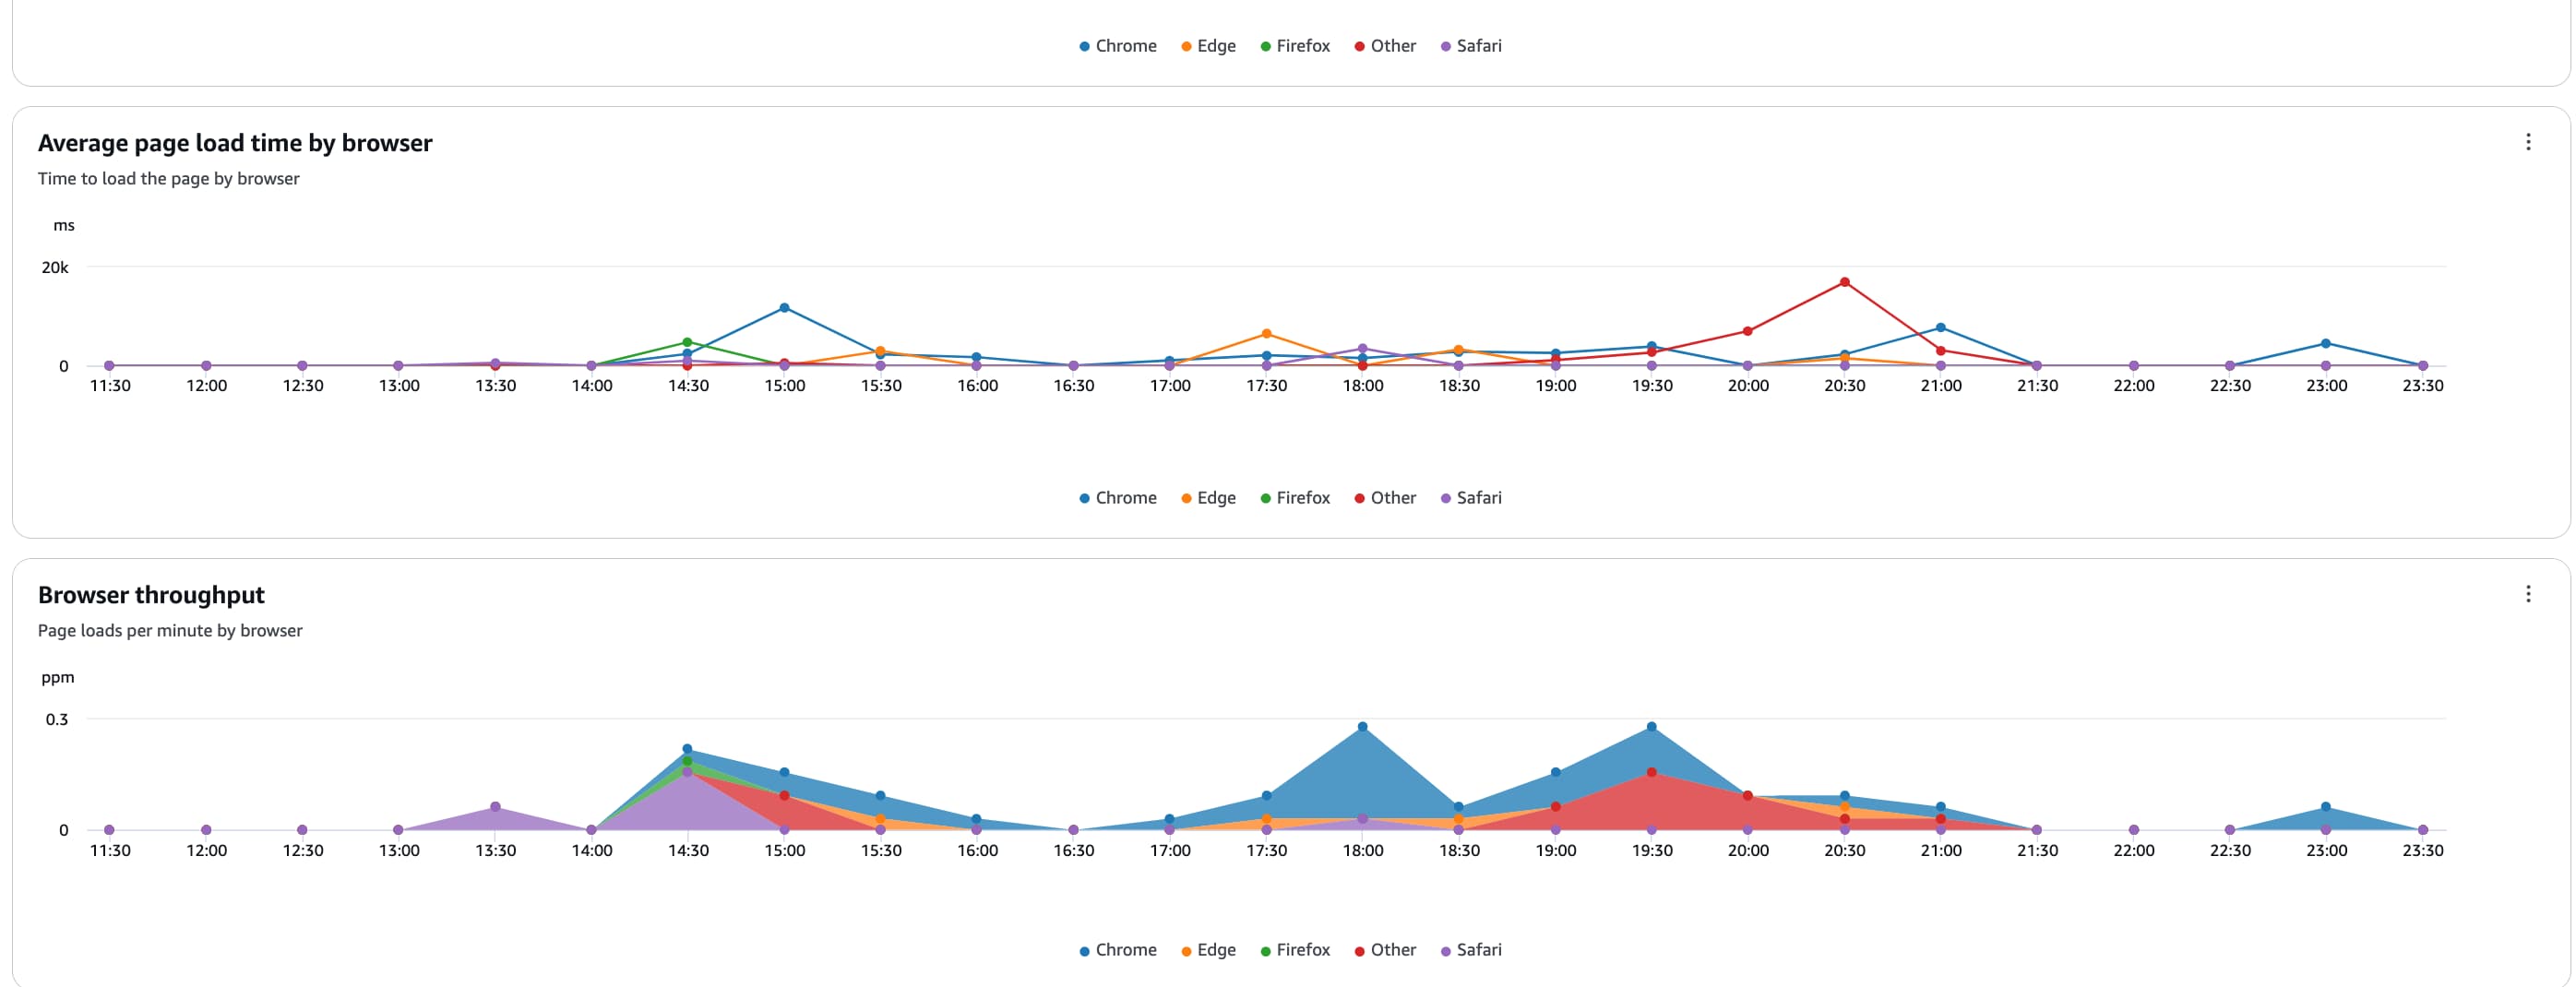
- Performance
- Errors
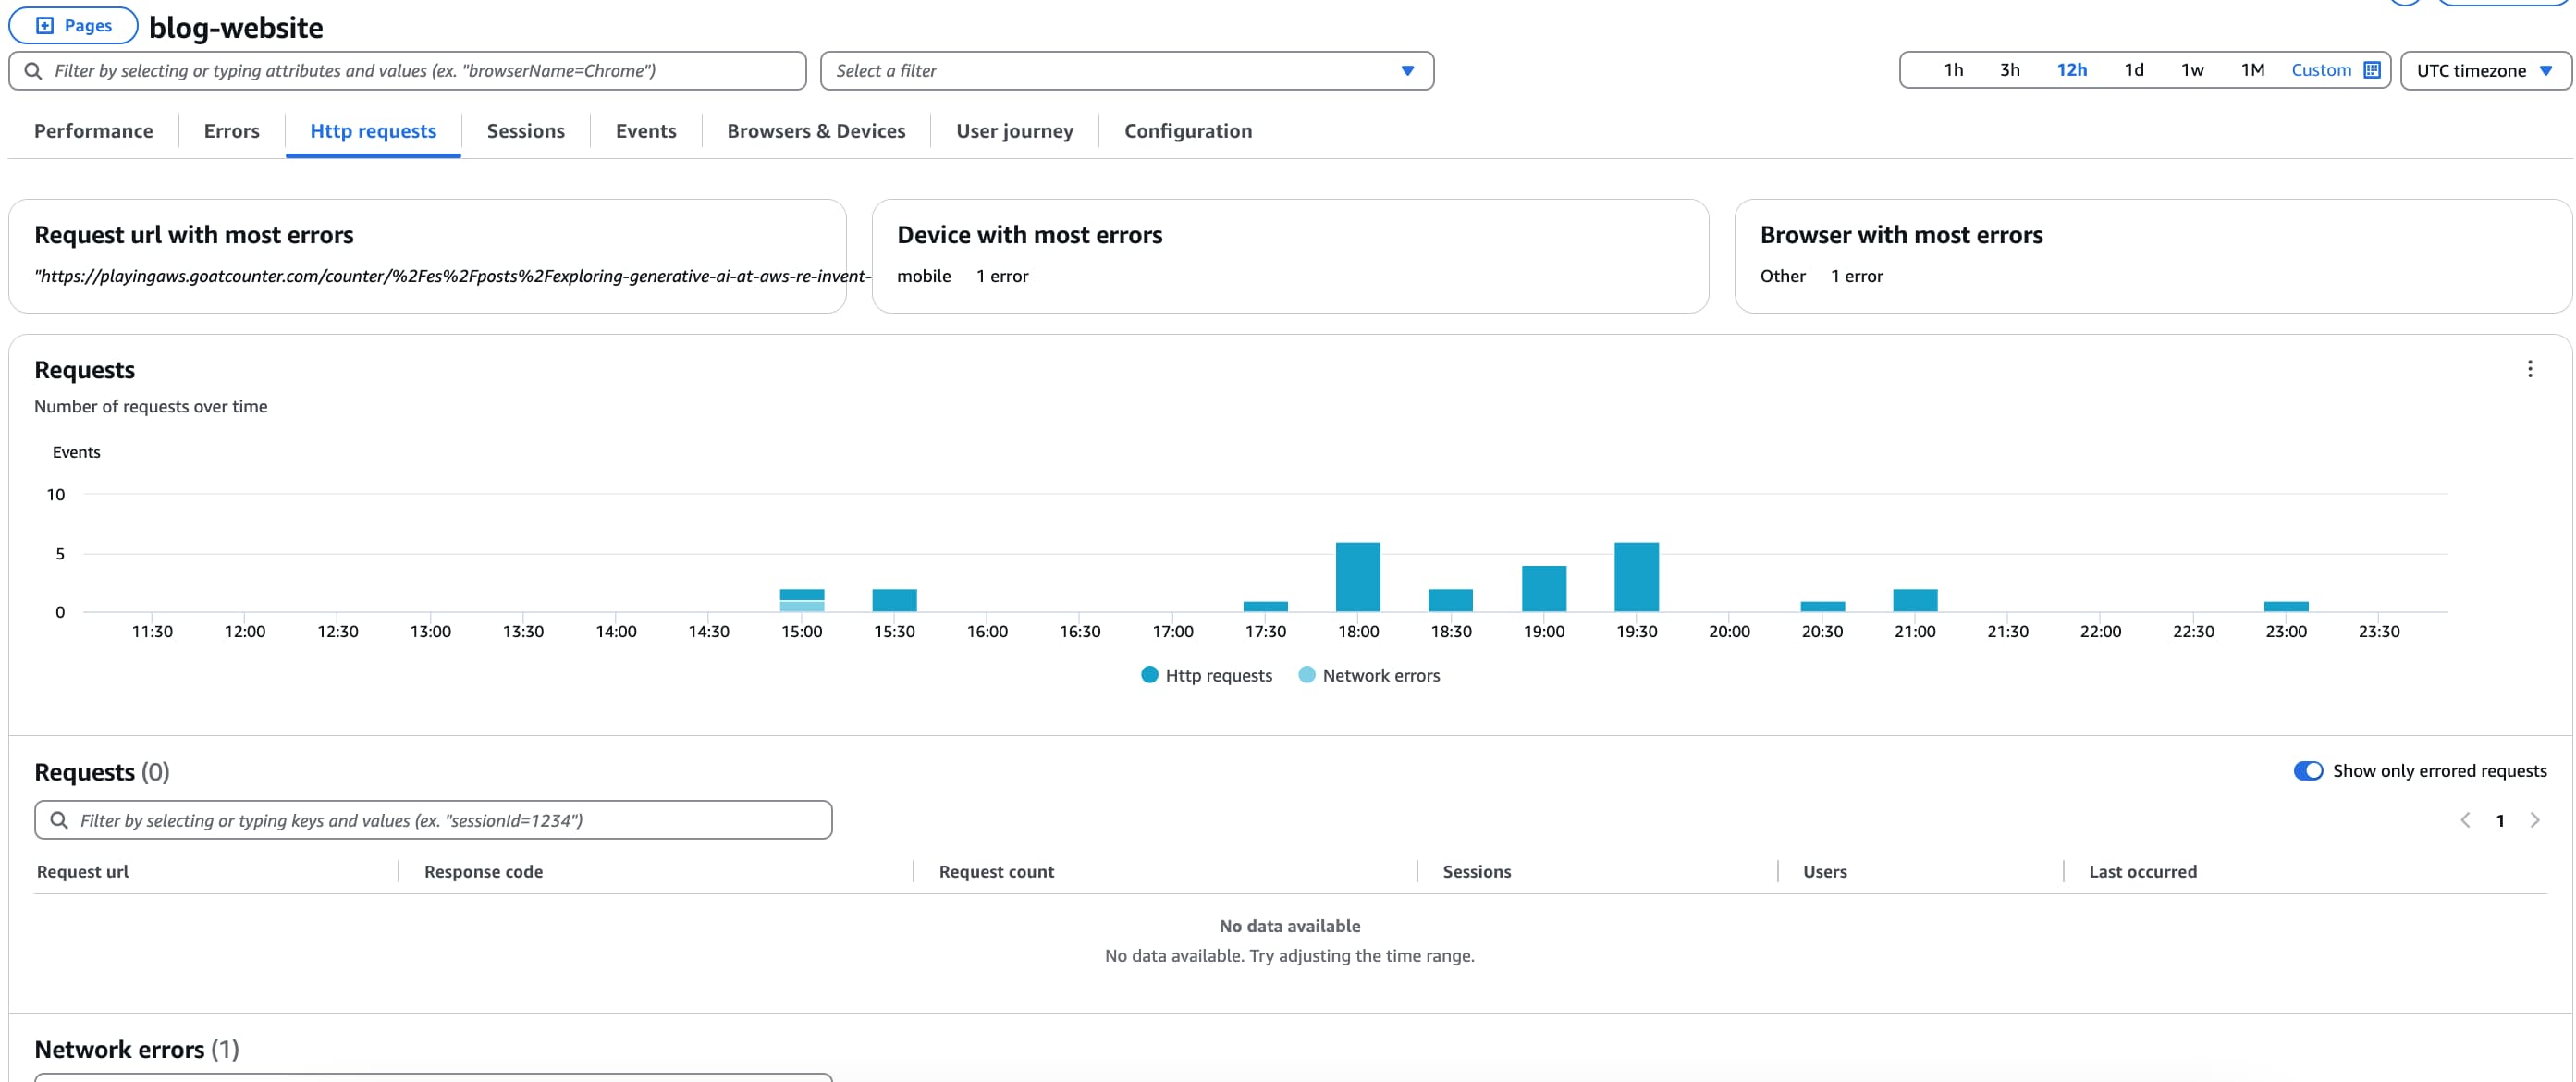
- Http requests
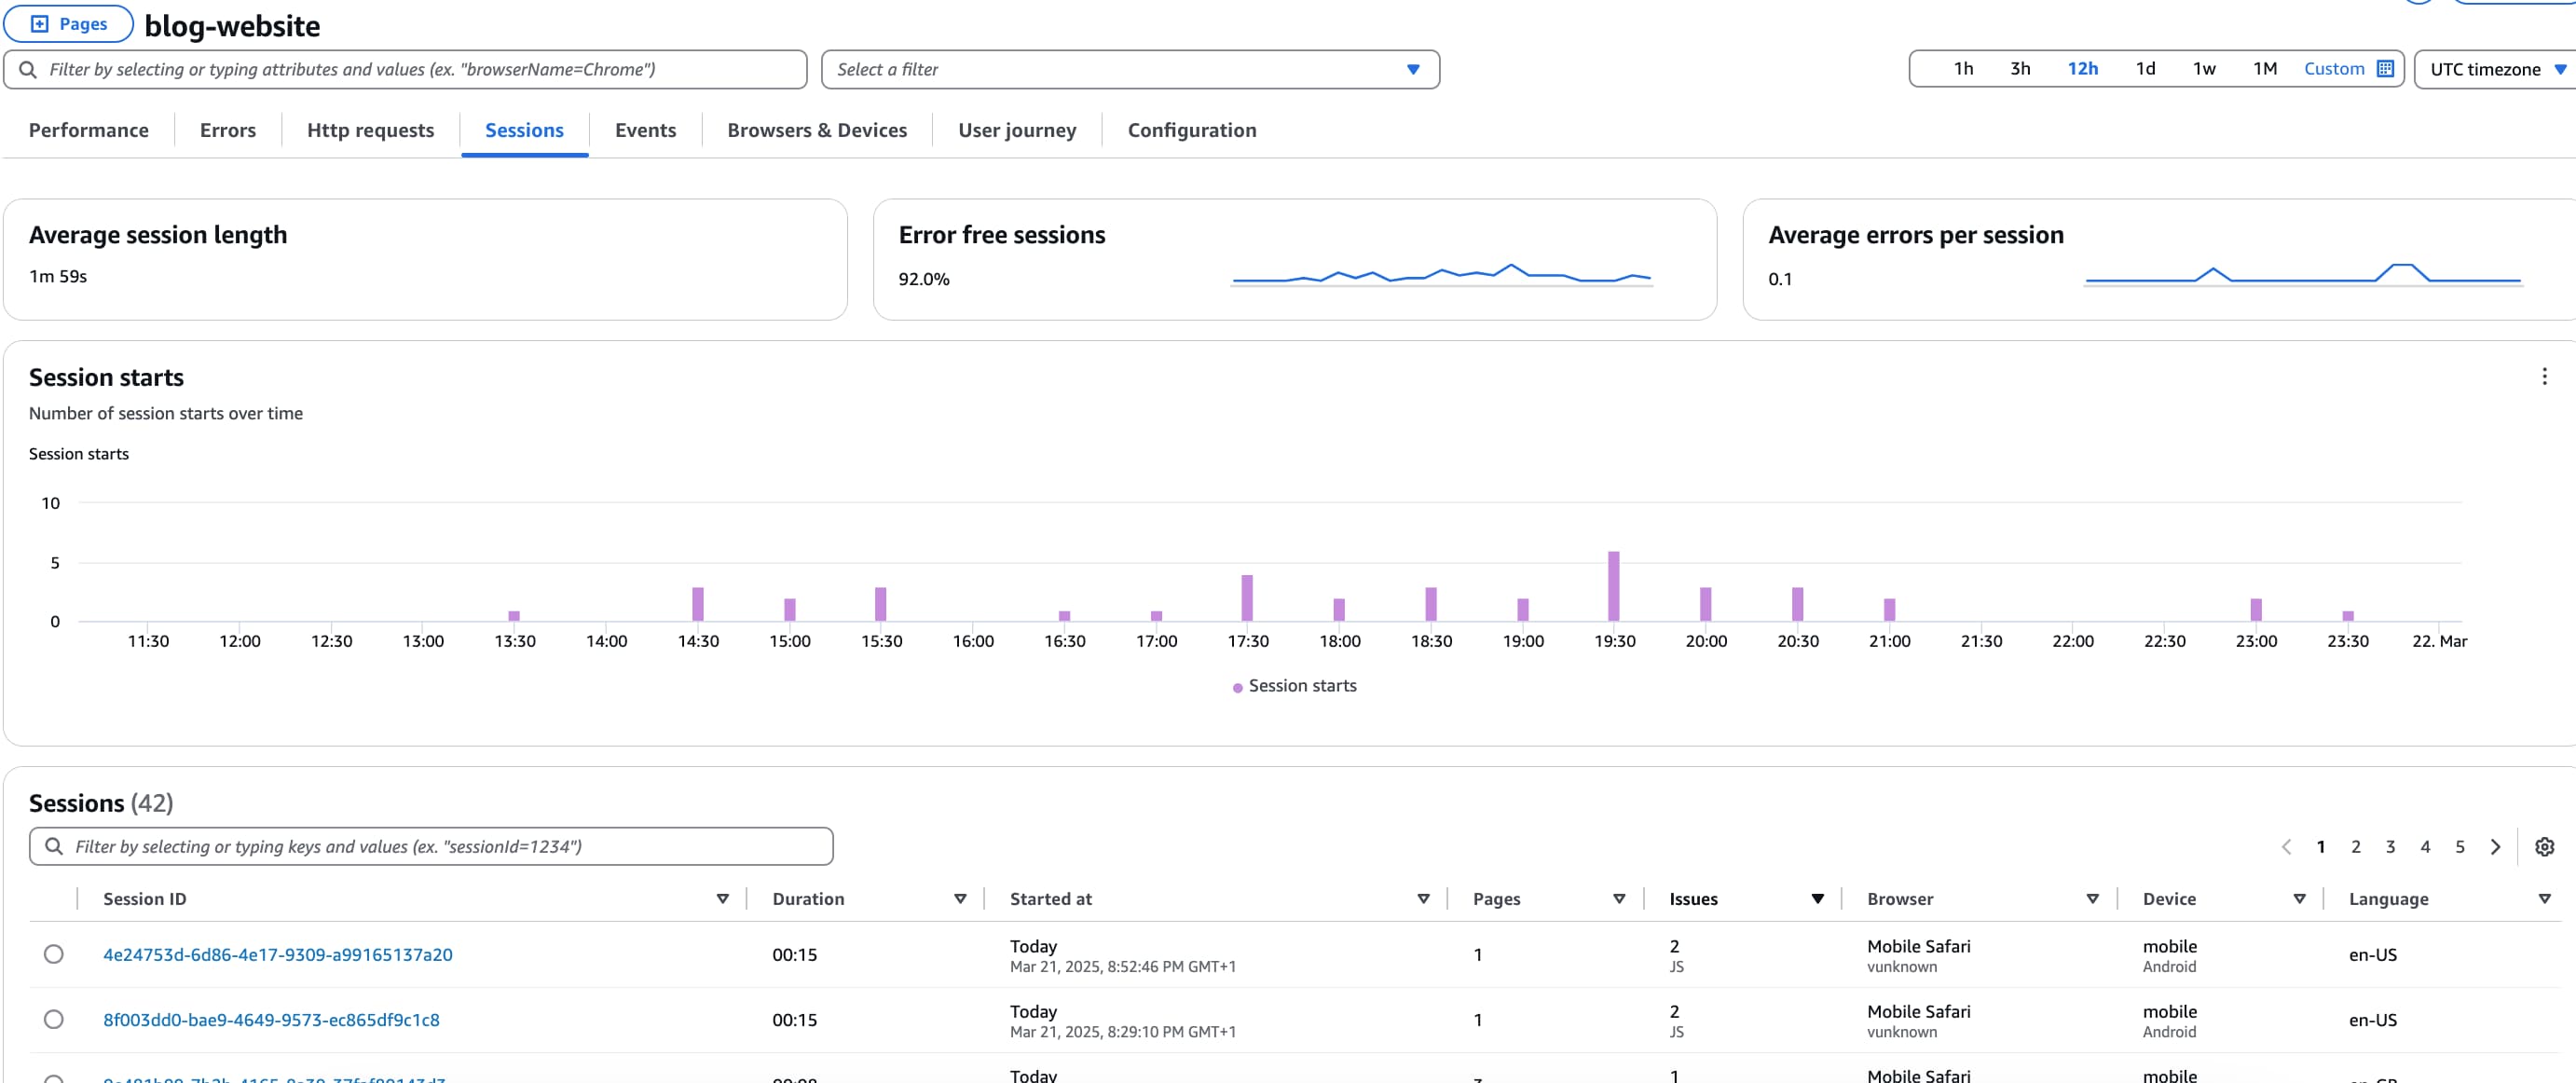
- Sessions
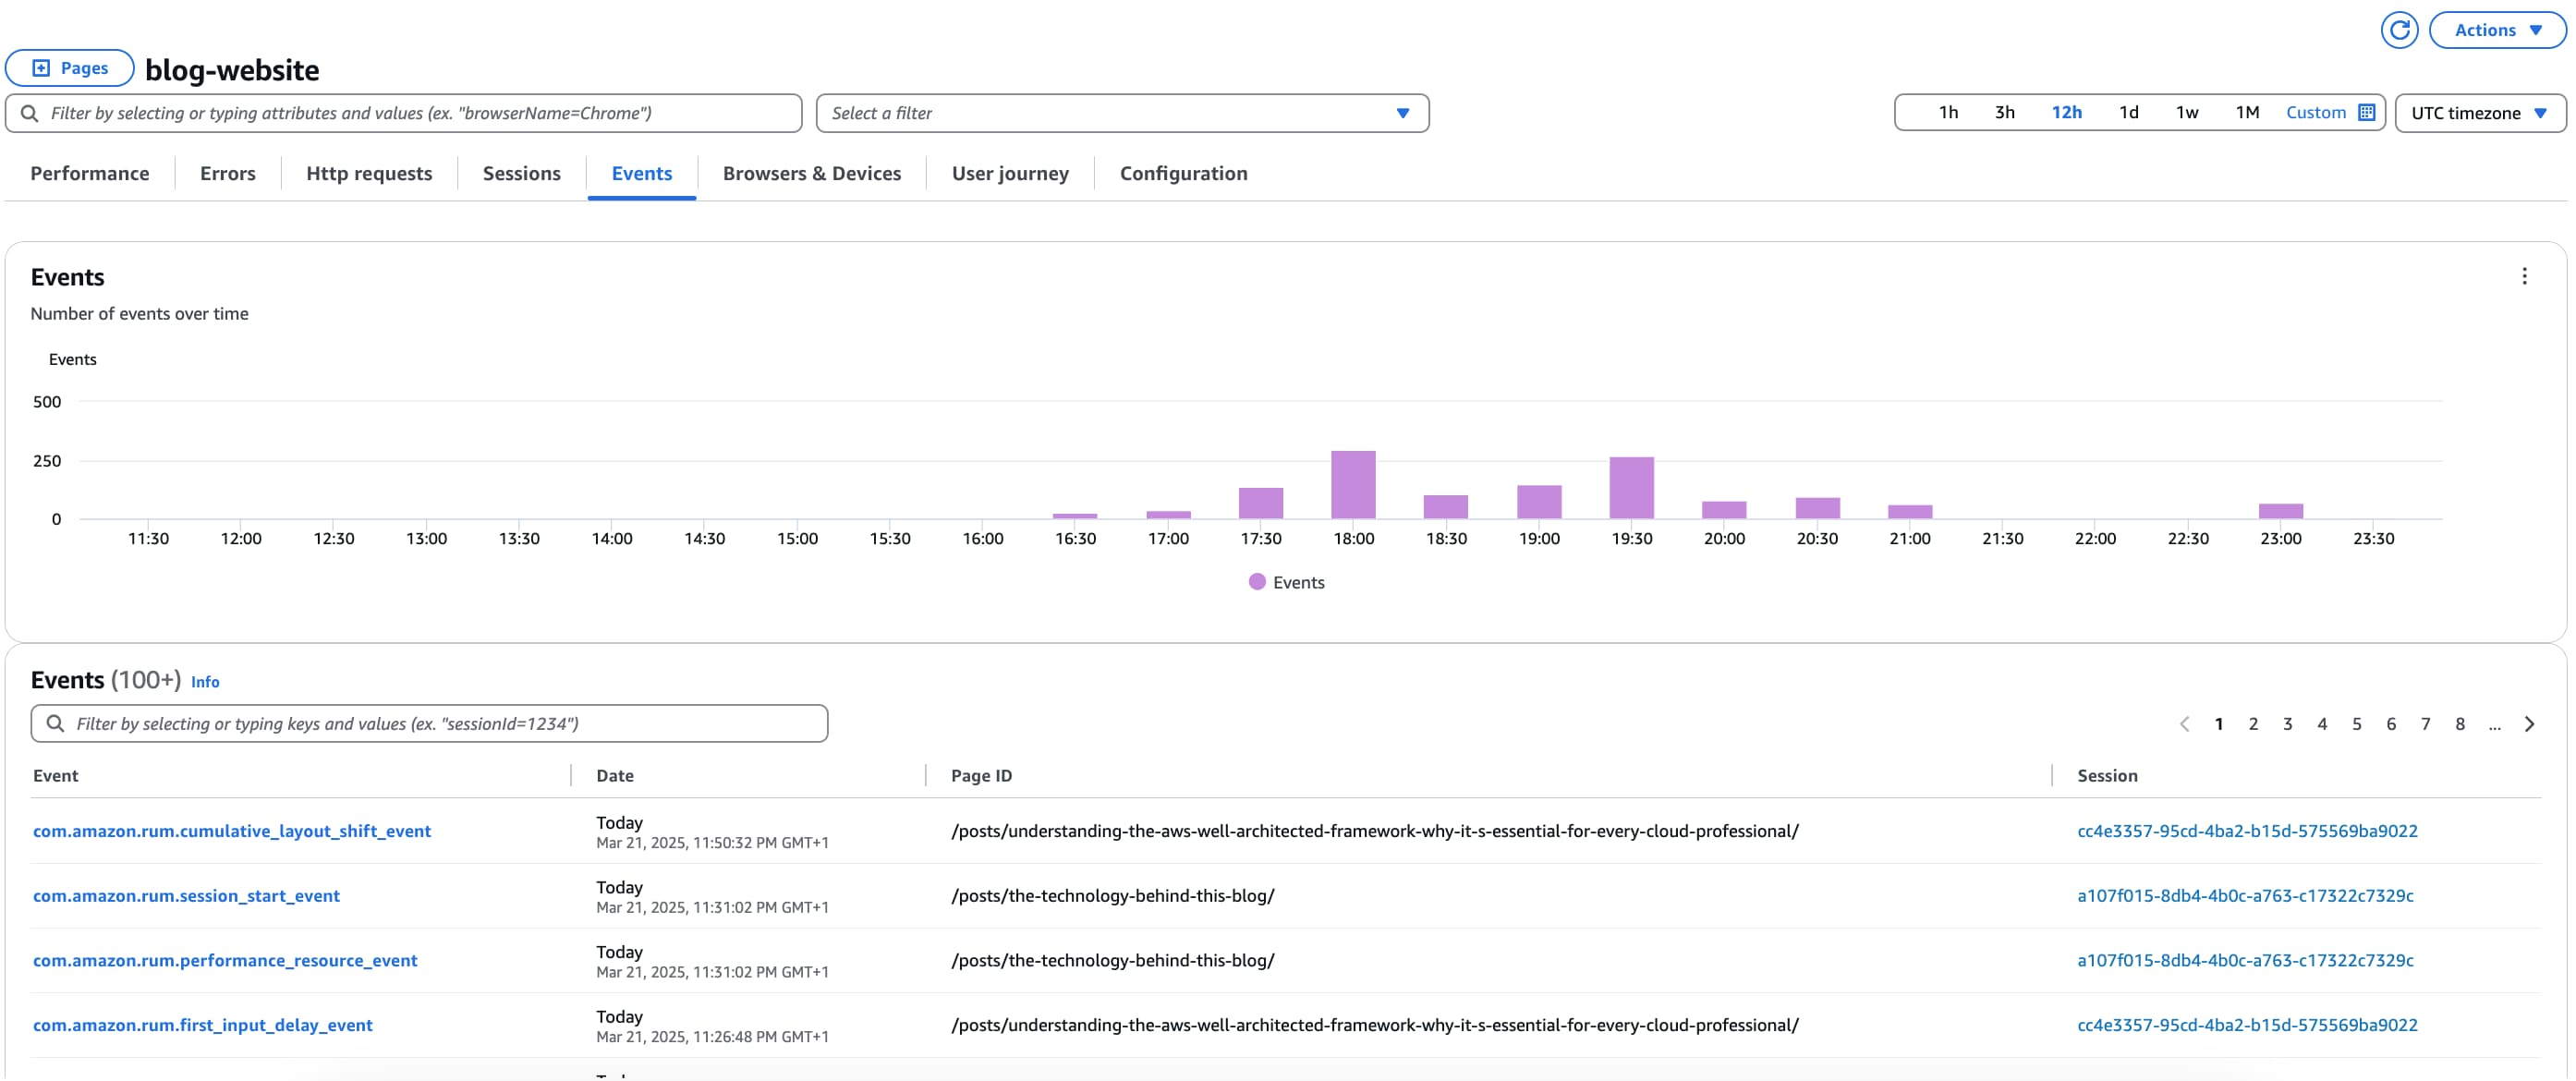
- Events
- Browsers & Devices
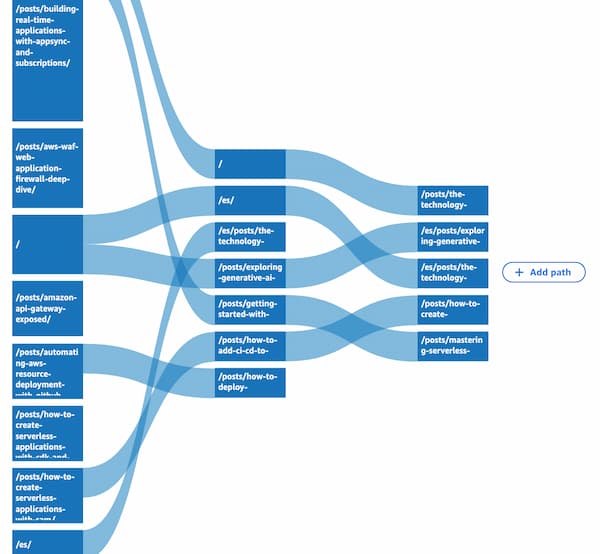
- User journey
- Configuration


4. Best Practices for CloudWatch RUM
- Minimize data collection costs: Use sampling rates to control how much data is collected and sent to CloudWatch.
- Set up alerts: Configure CloudWatch Alarms to get notified about significant performance issues.
- Set up custom events for specific user interactions you want to track
- Combine with other AWS monitoring tools: Use CloudWatch Metrics, Logs, and X-Ray together for a full observability stack. Consider integrating with CloudWatch Application Signals for a more comprehensive view of your application’s performance.
- Optimize frontend performance: Address high-latency issues identified in RUM reports to improve page speed.
5. CloudWatch RUM Pricing
Amazon CloudWatch RUM pricing is based on the number of events recorded per session. An event can be a page load, a user interaction (like a click), an error, or an HTTP request.
The key pricing factors are:
- Sessions: A session represents a user’s interaction with your application within a defined period (default: 30 minutes).
- Events per session: Each session can generate multiple events (page loads, API requests, errors, etc.).
- Pricing model: You are charged per 100,000 RUM events, with regional variations in pricing.
- Data retention: CloudWatch stores data for a specific retention period, and additional data storage may incur extra costs.
Free Tier: AWS offers 1 million free RUM events per month.
Pricing example extracted from the AWS website:
If your application has
500,000 visits in a month, and you’re collecting CloudWatch RUM events at 100% sampling for page load performance and errorswith 20 data events— including one start event, one page view event, and 10 performance events (three web vitals, one paint, one navigation, five resource loads), and eight errors per visit — your charges would be as follows:Total number of RUM data events = 20 data events/visit * 500,000 visits = 10,000,000 data events
Charges for
10,000,000 RUM data events at $1per 100,000 data events = 10,000,000 * $1/100,000 = $100Monthly CloudWatch RUM data events charges =
$100 per month
For my blog, **the cost has been $0 in the three months I have using it** (less than 1 million of requests).
Link to the Amazon CloudWatch Pricing page.
Cost Optimization Tip: Adjust the sampling rate to track only a percentage of users instead of all traffic.
6. Conclusion
Amazon CloudWatch RUM provides real-time insights into how users experience your web application. By tracking performance metrics, errors, and user interactions, you can identify issues early and enhance your site’s responsiveness.
Setting up RUM is quick and straightforward, making it an excellent addition to your monitoring strategy. When combined with CloudWatch Metrics, Logs, and X-Ray, it offers a complete observability solution.
If you haven’t tried CloudWatch RUM yet, now is the perfect time to integrate it and ensure a seamless user experience!